Dashboard data improves pharmaceutical supply-chain decision-making in Namibia’s public health facilities
Dashboard data improves pharmaceutical supply-chain decision-making in Namibia’s public health facilities

Yousef Makar is the Chief Pharmacist at the Windhoek Central Hospital, Namibia’s national referral hospital for specialized health care services for the past five years. Before July 2016, Yousef and other pharmacy managers in government health facilities faced huge challenges in managing the inventory of pharmaceuticals with frequent stock-outs of key pharmaceuticals because consumption information had to be extracted from outdated paper-based inventory management systems. It required a huge effort to aggregate the data necessary for pharmaceutical decision-making and to estimate accurately the quantities of pharmaceutical products they needed to ensure a reliable supply for patients.
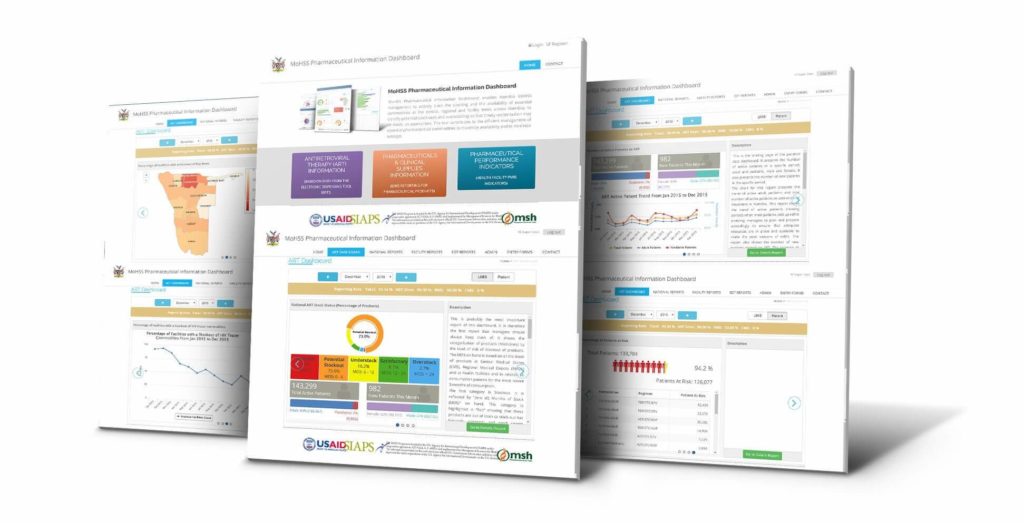
The introduction of a web-based pharmaceutical management information system (PMIS), known as the Pharmaceutical Information Dashboard, or more commonly, the dashboard, has transformed decision making in pharmaceutical commodity management. Through the dashboard, Yousef can quickly view stock quantities and availability over and above what is supplied by the Central Medical Stores (CMS). He can also access other facilities’ data, which aids in the redistribution of items that are out of stock at his facility. Electronic stock management systems regularly upload stock consumption data to the dashboard, allowing pharmacy managers to use the information to estimate their stock requirements, thereby reducing stock-outs of pharmaceuticals seen in the past. This has been the impact of the dashboard, which was implemented at public health facilities in Namibia in 2016.
The USAID-funded Systems for Improved Access to Pharmaceuticals and Services (SIAPS) Program collaborated with the Ministry of Health and Social Services (MoHSS) to implement the dashboard to enhance visibility and enable the MoHSS to monitor the stocking and availability of antiretroviral (ARV) and other essential medicines, vaccines, and clinical supplies at the central, regional, and heath-facility levels across the country.

Prior to the dashboard, everything was manual, including physical counts of pharmaceutical items, antiretroviral therapy (ART) and tuberculosis monthly reports, and reviewing hard-copy order books.
“It was a difficult process. The stock cards sometimes got lost. Doing manual calculations for minimum, maximum, and monthly consumption took time, and to extract data and put in spreadsheets to be processed, was time consuming,” said Yousef.
The challenges associated with the manual processes were numerous: Pharmacy staff needed time to collect the data, the validity of the data was sometimes questionable, and filing and retrieving data was problematic. Most importantly, the warning system for stock availability was poor unless someone did a physical check. Health managers, who are responsible for decision making at health facilities, could neither view nor access other facilities’ data for better stock management and redistribution.
According to Tafadzwa Marimo, a Pharmacist from Keetmanshoop District Hospital, this was “time consuming … decisions could not be made on time, and it was also labour intensive.” Tafadzwa started using the dashboard toward the end of 2016.
The dashboard has three main features. The ART dashboard provides a summary of the number of people accessing HIV treatment and an early warning system on potential stock-outs of ARVs, essential commodities, and clinical supplies. The dashboard provides managers with visibility of stock status for all essential health products at the central, regional, and facility levels as well as trends in national essential pharmaceutical information management indicators.
Pharmacy managers have access to a number of reports on many aspects, including the Logistics Management Information System, zero stock, ART, main and special orders, products at risk of expiry, and stock levels at CMS, regional medical stores, and other facilities. These reports can help managers estimate growth in medicine demand, future human resource requirements, increased workload, and changes in morbidity, and can also help them advocate for additional resources.

The main issues that Yousef and other managers have to address are checking for stock-outs, ordering available items from the medical stores, and checking for availability for the purpose of redistributing stock between health facilities. Decision making in emergency stock-out situations can be delayed by the lack of information on stock status. For example, in 2015 and 2016, the lack of stock status visibility led to critical stock-outs of ARV medicines.
The dashboard has also brought huge improvements in the ability of National Medicines Policy Coordination (NMPC), a subdivision of the Pharmaceutical Services Division of the MoHSS, in managing the logistics systems for pharmaceutical products. The ART Logistics Pharmacist at NMPC, Wuletaw Churfo, has benefited greatly from implementation of the dashboard, because he no longer has to manually aggregate the data and create reports from paper-based systems. However, he acknowledges that, although the dashboard has made the work of health managers and logistics pharmacists easier, continuous training of end users will ensure that pharmacy staff upload all required reports onto the dashboard. Wuletaw collects and summarises reports from about 70 health facilities countrywide to compile quarterly ART PMIS feedback reports.
Once Internet connectivity and training issues have been resolved, the impact of visualising critical information from the national, regional, and health-facility levels through the dashboard will even be greater, says Wuletaw.